

EOC2059: 25G VCSEL Driver/CDR
A single-channel 25Gbps VCSEL laser driver and single-channel 25Gbps limiting amplifier support 8.5-28.1Gbps operation. Features include programmable TX input EQ gain of 0-10dB, 10mVppd RX input sensitivity, and programmable RXLOS threshold and hysteresis.
 Save to Favorites
Overview
Datasheet
Please provide your email to download the datasheet.
Invalid email format. Please try again.
Supplier Information
Related Products
-
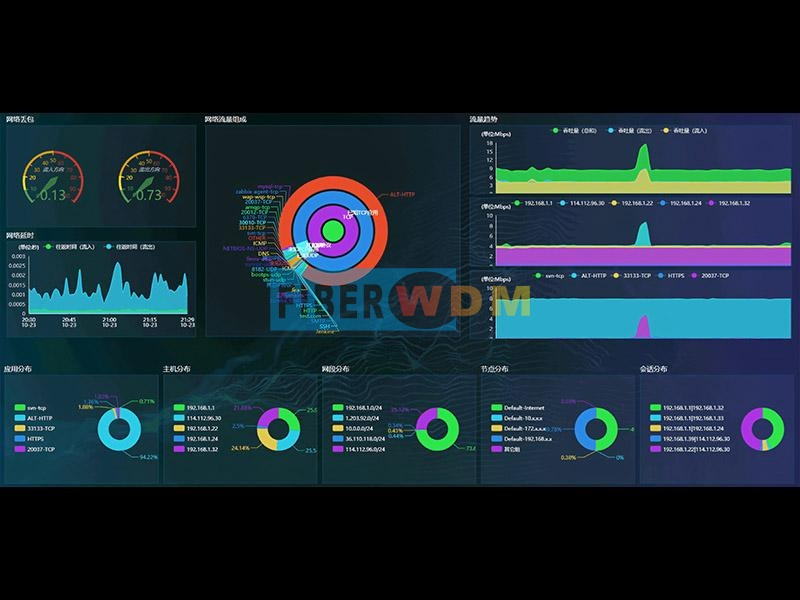 Network Performance Management - NPM
Software and Data Services
Fiberwdm
NPM provides network-traffic/quality monitoring and detailed link, host, subnet, workgroup and session analysis. Traditional SNMP/log management monitors hosts/devices, faults, changes, traffic, topology and resources, but critical network-dependent applications need faster recovery for productivity. Limitations include poor insight into trends for proactive planning, insufficient visibility of application ports/bandwidth/KPIs, inability to separate business/nonbusiness traffic, and lack of real-time warnings for latency, server response and retransmissions. The NPM appliance integrates OS/software, collection, computation, analysis and storage, accessed through a browser. Deployed at key nodes, it captures critical-area traffic via switch mirroring, analyzes/stores it, and loads modules for operating/performance metrics and alarms. Browser-based centralized management provides alarm analysis, aggregated reports, configuration, viewing/search and data mining.
-
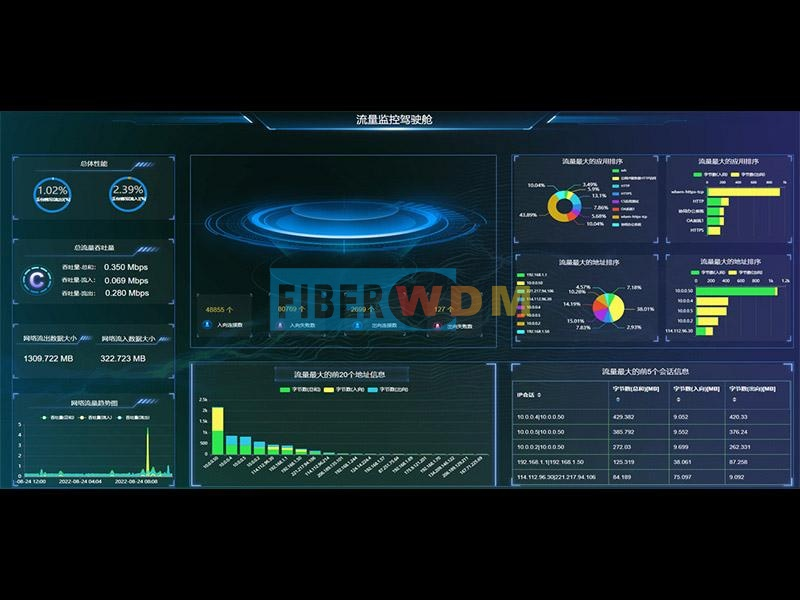 Observability Analysis Platform - NOP
Software and Data Services
Fiberwdm
This observability platform combines live probe data, service logs, system files, tracing logs and cloud data into business-context views. Cloud, big data, AI and blockchain drive digital transformation and changes in operations/consumption, increasing competition in business models/efficiency. Complex internal/external IT directly affects digital-service quality, efficiency, market development and competitiveness. IT has shifted from delivery to business-integrated operations; understanding customer/prospect behavior and IT's effect on experience is essential. Availability/performance supports digital growth. Observability is part of full-traffic retrospective analysis: users create/share views for a live global picture. More than ten dimensions, hundreds of metrics and dozens of components combine freely. Any automatically identified traffic/object or drill-down result becomes a scenario-, industry-, department- or person-specific live monitoring/alarm dashboard, with further drill-down. The solution combines observability-analysis software with full-traffic retrospective-analysis hardware. The software securely reads metrics/data from analysis appliances and other sources for comprehensive monitoring. Each independent appliance integrates OS/software, collection, computation, analysis and storage; both systems are browser-accessible. Each appliance is only one platform data source, read securely and displayed independently or relationally. Appliances at key nodes/areas/locations collect mirrored traffic, analyze/store it and run modules for network/application metrics and alarms. Installed beside monitored links, they import switch-mirrored traffic. Installation/configuration is stated to finish within one hour with zero network impact and no server/client agents, including SNMP agents. Platform software can install on any OS; platform and appliances run independently without affecting one another.
-
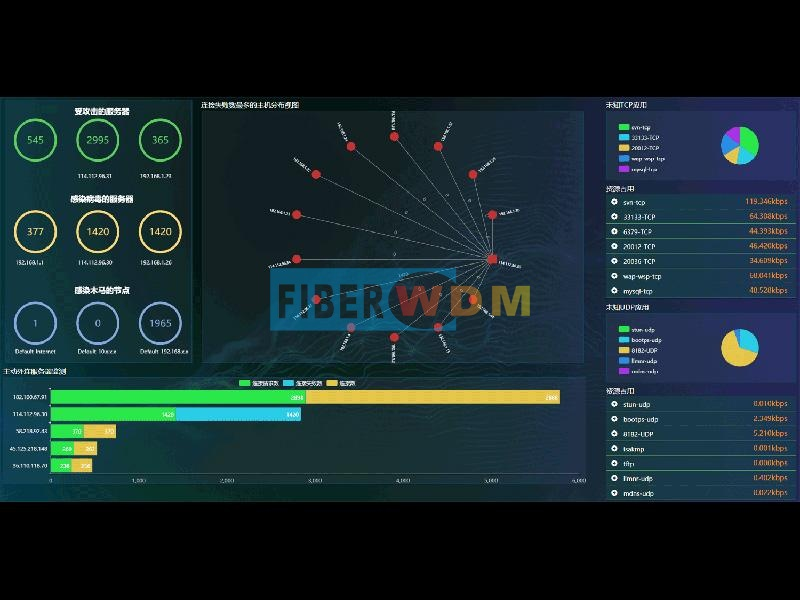 Abnormal Traffic Detection and Analysis System - ATA
Software and Data Services
Fiberwdm
ATA detects/analyzes abnormal traffic through behavioral features, identifying abnormal workgroups/hosts and active outbound server connections. Administrators can use time-based traffic/application trends to spot sudden rises/falls and identify top users/applications behind performance loss, then resolve faults rapidly. Conventional internal security recognizes IP-payload signatures, requiring a continually updated database and missing new/variant attacks. ATA instead monitors network-wide IP traffic and host behavior. Its built-in engine automatically detects/alarms on suspicious traffic such as host scans, port scans, worms and suspicious connections, helping maintain normal operation.
-
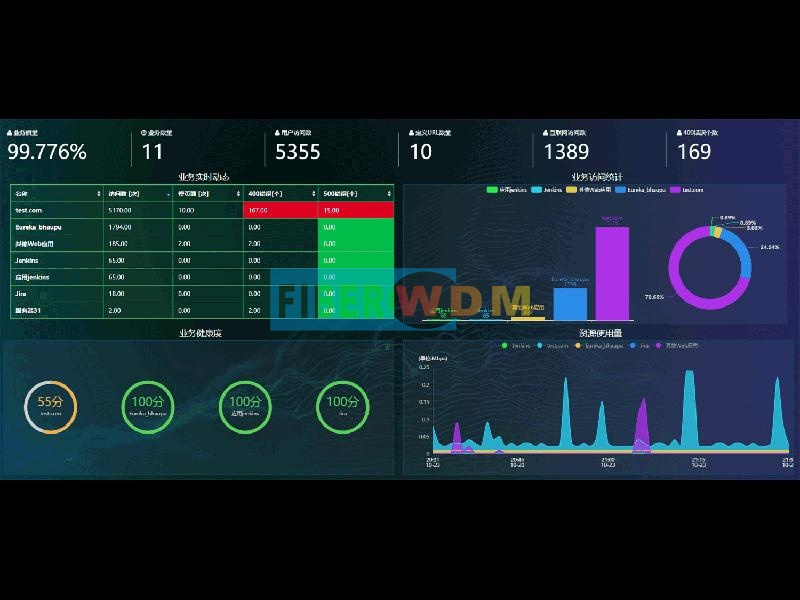 Business Performance Management - BPM
Software and Data Services
Fiberwdm
BPM monitors business access in real time and analyzes root causes of individual transaction-performance problems. Distributed/cloud applications make logic, networks and traffic increasingly complex, complicating reliable efficient operation, fault location and detection of security/business risks. Time-sensitive services need fast recovery. Conventional management is reactive to complaints, lacks proactive KPI warnings, cannot promptly flag latency/server response/retransmissions, lacks historical records for slowdowns/outages and struggles to resolve root causes. Needs include multidimensional performance monitoring from end-user perception, historical replay for fast diagnosis,7×24 regional experience monitoring with prompt response, and open APIs for third-party integration, real-time secondary analysis, operational big data, market intelligence, BI dashboards, custom reports, ad hoc queries and online analysis. The BPM appliance integrates OS/software, collection, computation, analysis and storage behind browser access. Out-of-band deployment near important business-server zones captures mirrored traffic, analyzes/stores it and runs modules for operating/performance metrics and alarms. No third-party client is needed: browsers centrally manage alarms, aggregated reports, configuration, viewing/search and data mining.
-
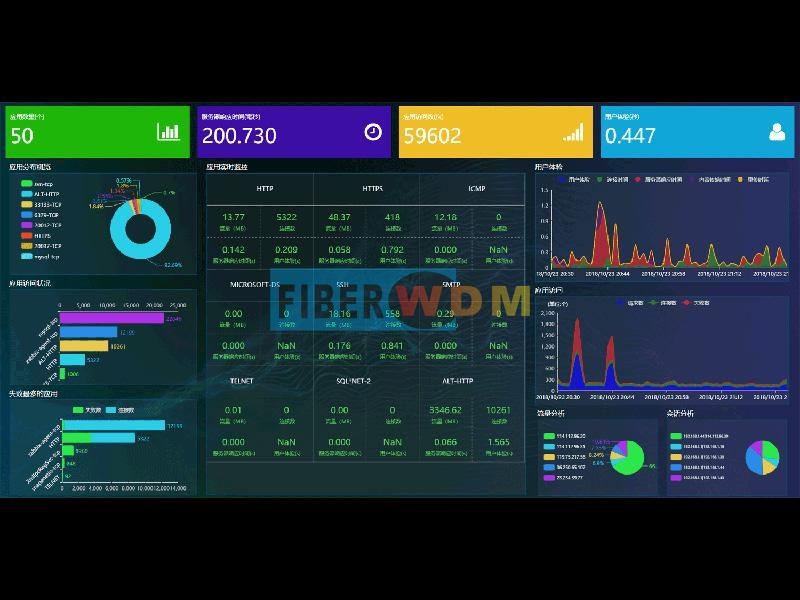 Application Performance Management - APM
Software and Data Services
Fiberwdm
APM provides real-time application-performance monitoring, analysis/alarms and end-user-experience analysis. It warns before performance issues and helps locate/resolve failures. Needs include proactive health/user-experience visibility rather than complaints; historical-traffic replay to diagnose slowdowns/outages; real-time latency, server-response and access-quality warnings; detection/control of illegal traffic; live experience, business status, access quality and abnormal-communication alarms. API access supplies richer data for secondary development, operational big data, market intelligence, third-party integration, BI dashboards, custom reports, ad hoc queries and online analysis. The APM appliance integrates OS/software, collection, computation, analysis and storage behind browser access. Deployed near applications, it captures mirrored traffic from key areas, stores/analyzes it and loads modules for application operating/performance metrics and alarms. Central browser management provides alarm analysis, report aggregation, configuration, viewing/search and data mining.
Related Articles
The accelerated construction of new‑generation power systems has brought revolutionary upgrades to power‑equipment maintenance workflows.
Driven by fast‑growing demands of 3D perception, biometric authentication and machine‑vision industries, near‑infrared imaging optics have become a vital hardware component for intelligent sensing systems.
icrolight is a high-tech enterprise specializing in the R&D, manufacturing and sales of active and passive photonic devices for microwave photonics, LiDAR ranging, gas sensing, fiber optics and photomedicine.
Electro-optic deflectors (EODs) are optical devices used to steer or deflect light beams by applying an electric field to a specialized optical crystal. Unlike mechanical beam steering systems that rely on moving mirrors, electro-optic deflectors enable high-speed, non-mechanical beam control with exceptional precision and responsiveness. They are widely used in laser scanning, optical communications, microscopy, laser printing, spectroscopy, and scientific research, where rapid and accurate laser beam positioning is essential.
Loading...
Name
Phone
Organization
Use Case

Database Platform